BUDGET DEFICIT: DEMOCRATS VS. REPUBLICANS (graph, historical data)
Posted by FactReal on February 2, 2010
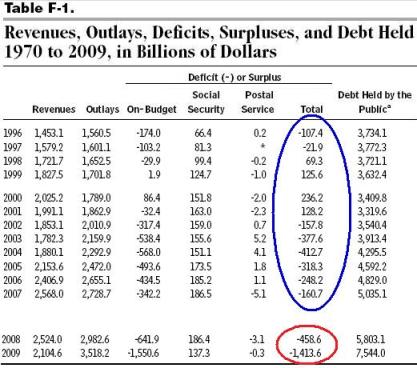
| OBAMA INHERITED THE HIGH DEFICITS FROM THE DEMOCRAT CONGRESS. Obama and the Democrats are constantly blaming Bush for the deficit. BUT they fail to mention that: 1- Congress approves the President’s proposed budget. 2- Since 2007, Democrats have been the majority in the Senate and in the House. That means that Democrats approved the budgets for Fiscal Year 2008 and Fiscal Year 2009 when the deficit increased exponentially (see tables below). |
|
| DEFICIT HISTORICAL DATA | FISCAL YEAR |
DEFICIT PER YEAR |
TOTAL DEFICIT |
AVERAGE DEFICIT |
||
| In Billions of Dollars | ||||||
|
REPUBLICAN CONTROLLED HOUSE In the 12 years that Republicans controlled Congress, the total deficit was $1.25 Trillion, and the average deficit was $104 billion (average of final deficit/surplus FY1996-FY2007 data taken from Table F-1 below). |
1996 | -107.4 | ||||
| 1997 | -21.9 | |||||
| 1998 | 69.3 | |||||
| 1999 | 125.6 | |||||
| 2000 | 236.2 | |||||
| 2001 | 128.2 | |||||
| 2002 | -157.8 | |||||
| 2003 | -377.6 | |||||
| 2004 | -412.7 | |||||
| 2005 | -318.3 | |||||
| 2006 | -248.2 | |||||
| 2007 | -160.7 | -$1.25 Trillion | -$104 Billion | |||
| DEMOCRAT CONTROLLED HOUSE In just 3 years under Democrats, the total deficit is $3.2 Trillion (almost triple the Republican total deficit in 12 years) and the average deficit is now almost $1.1 trillion (average of final deficit/surplus FY2008 and 2009 data taken from Table F-1; FY2010 data taken from Table 1-3). |
2008 | -458.6 | ||||
| 2009 | -1413.6 | |||||
|
*2010 Projection |
-1349 | -$3.2 Trillion | -$1.1 Trillion | |||
CBO’s Table F-1 (PDF page 144) |
CBO’s Table 1-3 (PDF page 26) |
||||
| ____ DEFICIT UNDER REPUBLICAN CONTROLLED HOUSE ____ DEFICIT UNDER DEMOCRAT CONTROLLED HOUSE |
|||||
| MORE FACTS Obama’s proposed budget will triple the national debt over the next 10 years. According to CBO’s June 2009 estimate of the President’s Budget FY2010 (PDF page 12), debt held by the public would rise from its 2008 level of $5.803 trillion to $17.126 trillion in 2019, which is 2.95 times larger than the 2008 level. Obama’s budget will triple the national debt and increase the cost of government to almost 25% of our economy: The old annual deficits under Republicans have now become the monthly deficits under Democrats. Even Republicans worst annual deficit – $412.7 billion in FY2004 according to OMB’s Historical Tables (Table 1.1) – is much lower than the Democratic deficits. According to CBO’s January Monthly Budget Review, in the first 3 months of FY2010 (October-December 2009) alone, Democrats have run up a deficit of about $390 billion. That is $22.7 billion shy of the GOP’s worst annual deficit. The national debt has increased 30%. |
|||||
DEFICIT GRAPH |

MICHELLE OBAMA’S VACATION IN SPAIN (photos, videos, costs) « FactReal said
[…] – FOUNDING FATHERS and War (video) – Japanese Atrocities – THANKSGIVING real documents ECONOMY – BUDGET DEFICIT: Democrats vs. Republicans – ECONOMIC CRISTS: WHO CREATED IT OBAMA – Obama's ACORN fraud (videos) – Obama's school plan: […]
OBAMA’S ECONOMY: POVERTY INCREASED UNDER DEMOCRAT CONGRESS & PRESIDENT OBAMA (graphs) « FactReal said
[…] – FOUNDING FATHERS and War (video) – Japanese Atrocities – THANKSGIVING real documents ECONOMY – BUDGET DEFICIT: Democrats vs. Republicans – ECONOMIC CRISTS: WHO CREATED IT OBAMA – Obama's ACORN fraud (videos) – Obama's school plan: […]
Susanne said
Everyone in this country needs to see this video: Where did all the jobs go?